Sentry
Send traces to Sentry
This destination is currently in beta. The configuration and features may change.
Sentry is an application monitoring platform that helps developers identify and fix issues in real-time. With Sentry’s AI monitoring capabilities, you can track LLM performance and errors.
Step 1: Get your Sentry OTLP endpoint and DSN
In Sentry, navigate to your project’s SDK setup:
- Log in to your Sentry account
- Go to Settings > Projects > [Your Project] > SDK Setup > Client Keys (DSN)
- Click on the OpenTelemetry tab
- Copy the OTLP Traces Endpoint URL (ends with
/v1/traces) - Copy your DSN from the same page
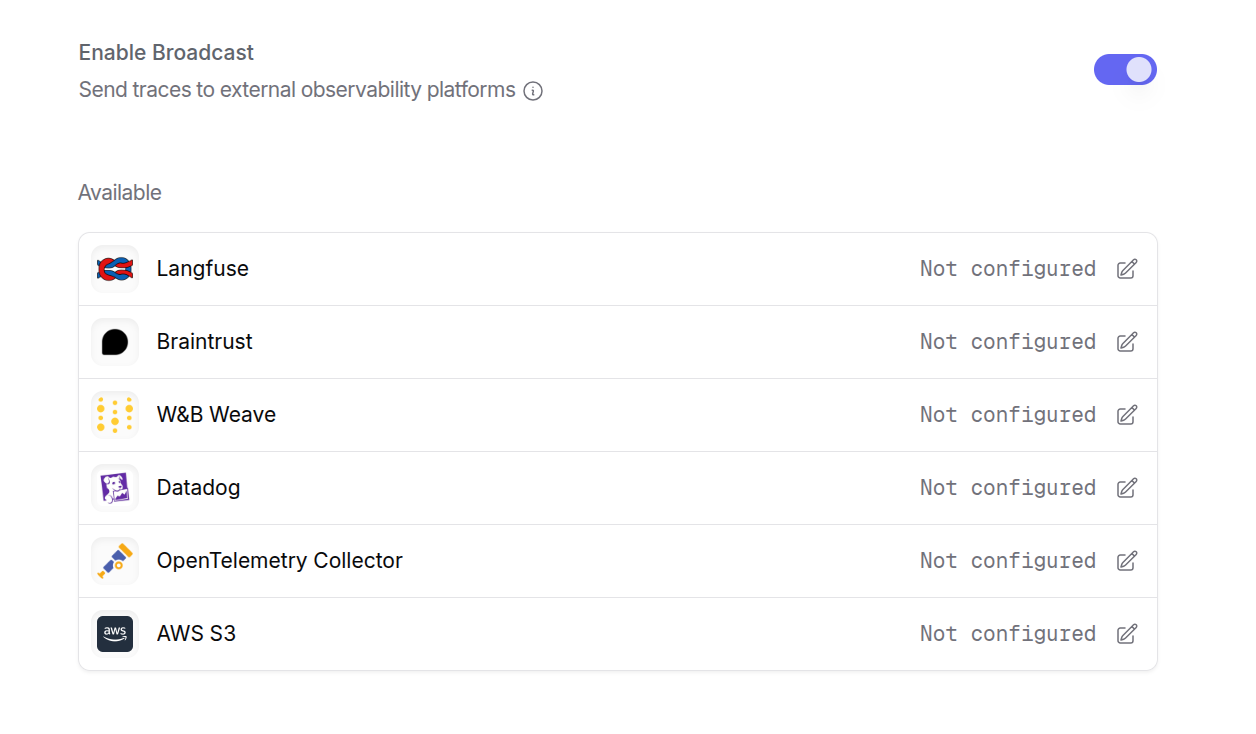
Step 2: Enable Broadcast in OpenRouter
Go to Settings > Broadcast and toggle Enable Broadcast.
Step 3: Configure Sentry
Click the edit icon next to Sentry and enter:
- OTLP Traces Endpoint: The OTLP endpoint URL from Sentry (e.g.,
https://o123.ingest.us.sentry.io/api/456/integration/otlp/v1/traces) - Sentry DSN: Your Sentry DSN (e.g.,
https://[email protected]/456)
Step 4: Test and save
Click Test Connection to verify the setup. The configuration only saves if the test passes.
Step 5: Send a test trace
Make an API request through OpenRouter and view the trace in Sentry’s Performance or Traces view.
Sentry uses OpenTelemetry for trace ingestion. The OTLP endpoint and DSN are both required for proper authentication and trace routing.